


Knowledge Base
Surface Finish Chart with Ra, Rz, RMS and N Grades
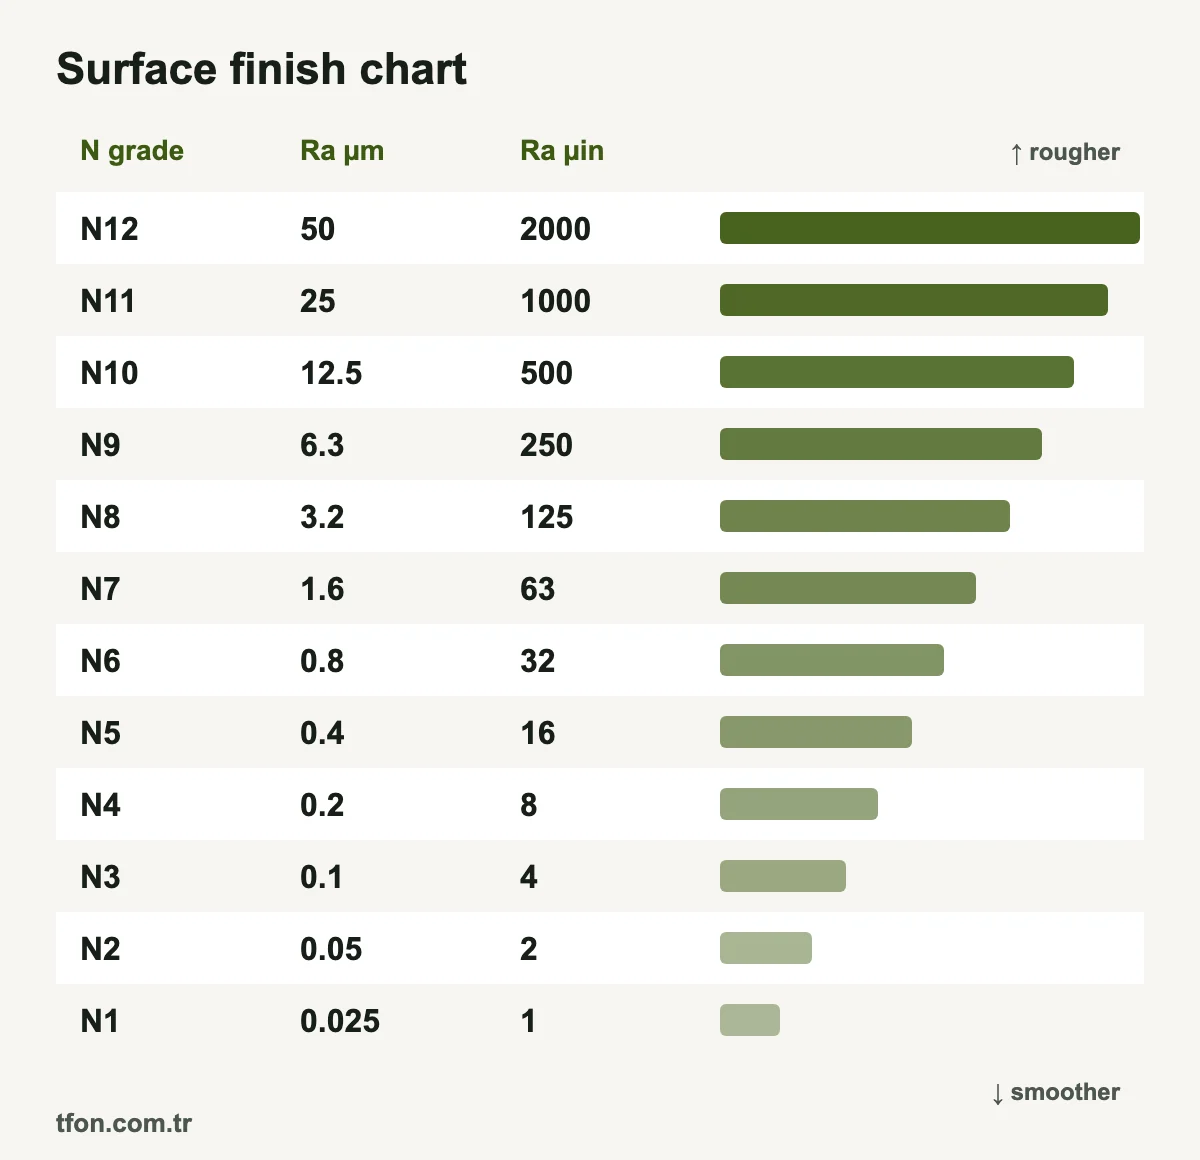
A surface finish chart lines up the common ways of stating roughness: ISO N grades N1 to N12, Ra in micrometers (µm) and microinches (µin), and approximate RMS. Each step doubles Ra, from 0.025 µm (1 µin) at N1 to 50 µm (2,000 µin) at N12. Rz has no exact conversion and is estimated separately.
TFON Machines for This Job
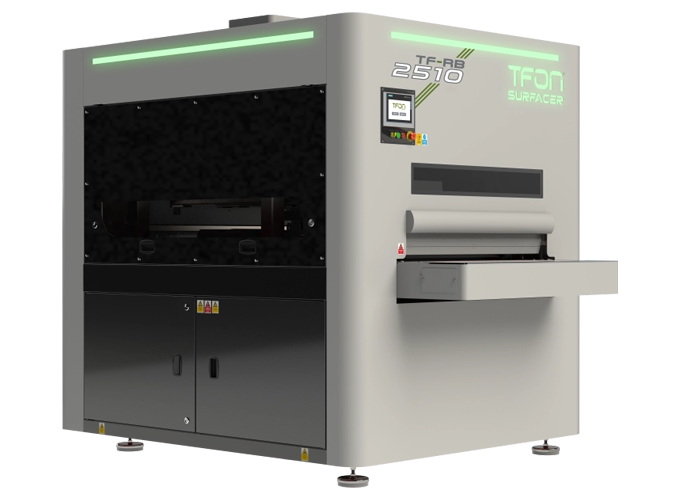
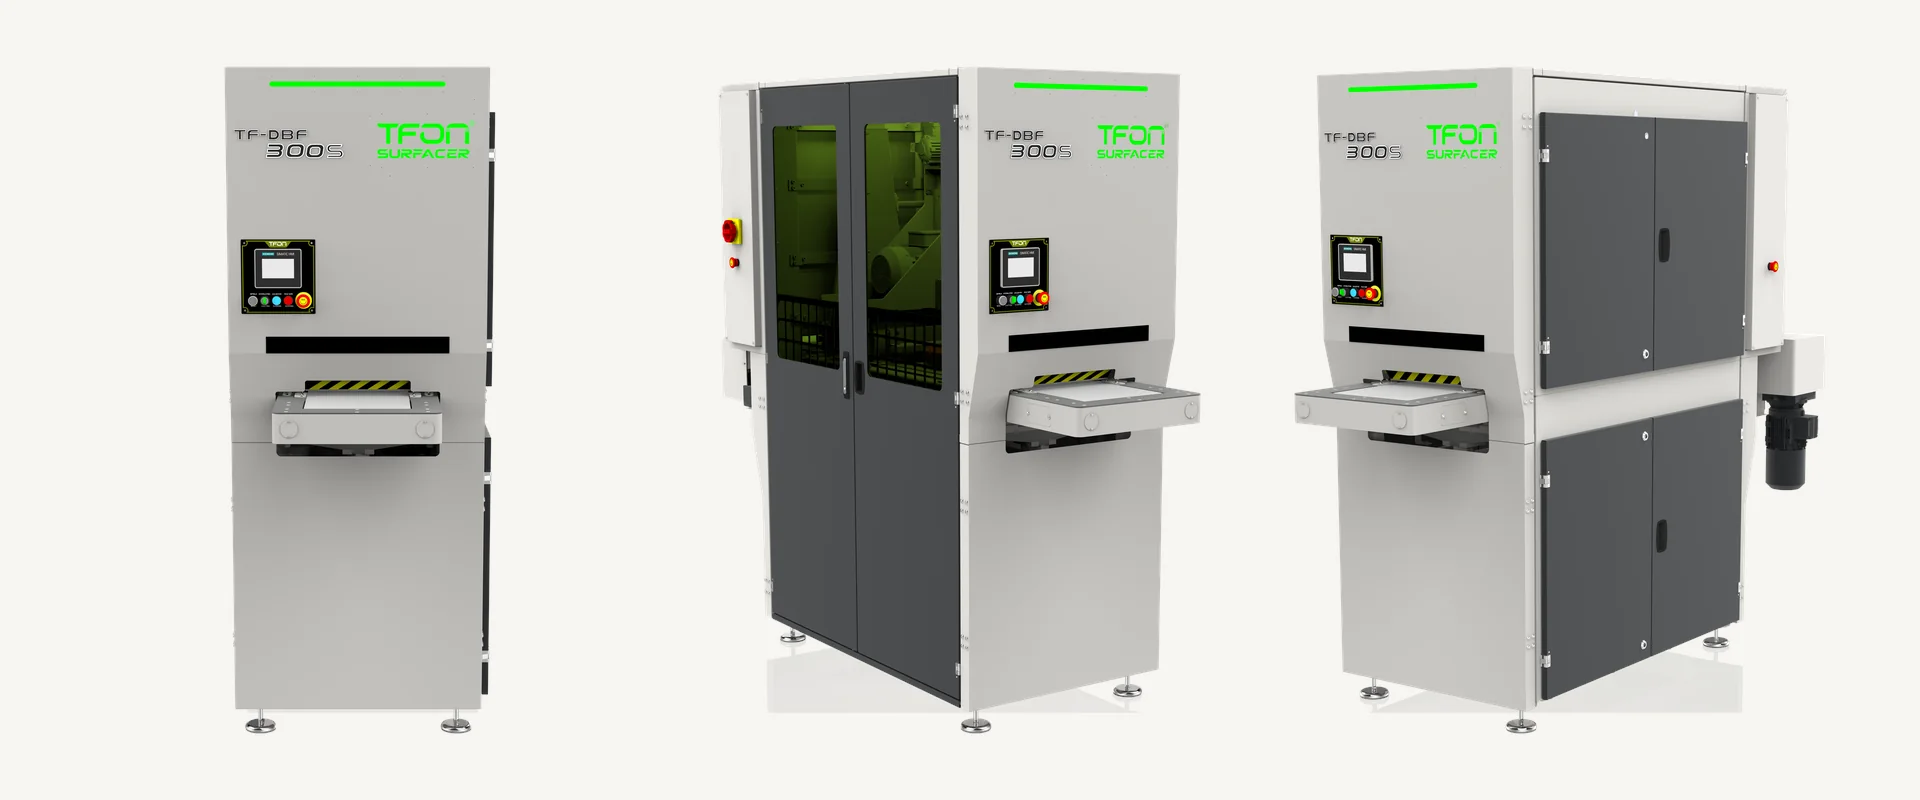
- TFON Surfacer® TF-RF-3013 Surface finishing machine; 1,300 mm working width; abrasive belt plus 8 flap wheels (Ø350 mm); conveyor 0.6-4.0 m/min Specifications Request a Quote
- TFON Surfacer® TF-RBF-3013 Deburring and finishing machine; 1,300 mm working width; deburring and satin finish in one pass Specifications Request a Quote
Surface Finish Chart: N Grades, Ra and RMS
The surface finish conversion chart below translates between the four ways roughness is usually written: ISO N grade, Ra in micrometers, Ra in microinches and approximate RMS. Find the value from your drawing in any column and read across the row. The last column names processes that typically reach that band.
| N grade | Ra (µm) | Ra (µin) | Approx. RMS (µm) | Approx. RMS (µin) | Typical processes |
|---|---|---|---|---|---|
| N1 | 0.025 | 1 | 0.028 | 1.1 | Superfinishing |
| N2 | 0.05 | 2 | 0.055 | 2.2 | Superfinishing, lapping |
| N3 | 0.1 | 4 | 0.11 | 4.4 | Lapping, polishing, honing, fine grinding |
| N4 | 0.2 | 8 | 0.22 | 8.8 | Polishing, honing, grinding |
| N5 | 0.4 | 16 | 0.44 | 18 | Grinding, polishing, fine turning |
| N6 | 0.8 | 32 | 0.88 | 35 | Grinding, reaming, fine turning and milling, cold rolling |
| N7 | 1.6 | 63 | 1.8 | 69 | Turning, milling, reaming, drilling |
| N8 | 3.2 | 125 | 3.5 | 138 | Turning, milling, drilling, forging |
| N9 | 6.3 | 250 | 6.9 | 275 | Rough turning and milling, sawing, forging |
| N10 | 12.5 | 500 | 14 | 550 | Oxy-fuel cutting, hot rolling, sawing, forging |
| N11 | 25 | 1,000 | 28 | 1,100 | Oxy-fuel cutting, hot rolling, sand casting |
| N12 | 50 | 2,000 | 55 | 2,200 | Rough flame cutting, outside the usual range of most processes |
Three notes apply to every row of the chart:
- Rounded microinches. The µin column holds the rounded values used on US drawings, not exact conversions. One µm equals 39.37 µin, so N8 (3.2 µm) is exactly 126 µin and N9 (6.3 µm) is 248 µin; charts and callouts use 125 and 250.
- Estimated RMS. The RMS columns use RMS ≈ 1.1 × Ra, an estimate that suits regular, periodic profiles.
- Typical processes. The process column shows where a process typically falls, not what a given machine will deliver.
The chart graphic at the top of this page shows the same values. This surface finish chart is also available as a printable PDF for the shop floor.
How to Read the Surface Finish Chart
Read the chart from top to bottom as smooth to rough: a lower N number and a lower Ra mean a smoother surface. Each row doubles the Ra of the row above, so one grade is a large step, not a fine adjustment.
- Identify the unit. A metric drawing gives Ra in µm, for example Ra 1.6. A US inch drawing usually gives Ra in µin, often as a bare number such as 63 above the symbol.
- Identify the parameter. Ra, Rz and RMS are different measures. Use the Ra columns only for Ra values.
- Read across. A US callout of 125 µin is Ra 3.2 µm, which is N8. A metric drawing with Ra 0.8 is N6, about 32 µin.
- Treat the value as a limit. A single value on a drawing is normally an upper limit, so a part measuring Ra 1.2 µm is within an Ra 1.6 requirement.
Values between rows are valid. Ra 1.0 or Ra 2.5 are legitimate specifications; they simply sit between grades. The doubling series of 0.4, 0.8, 1.6, 3.2 and 6.3 µm is still the set of values most drawings use.
Ra, Rz and RMS in Brief
Ra, Rz and RMS describe the same roughness profile in three different ways. Ra is the arithmetic average of the profile's distance from its mean line. RMS, written Rq in ISO 21920-2 and ASME B46.1, is the root mean square of the same distances. Rz is a height: the highest peak plus the deepest valley in each sampling length, averaged over the evaluation length.
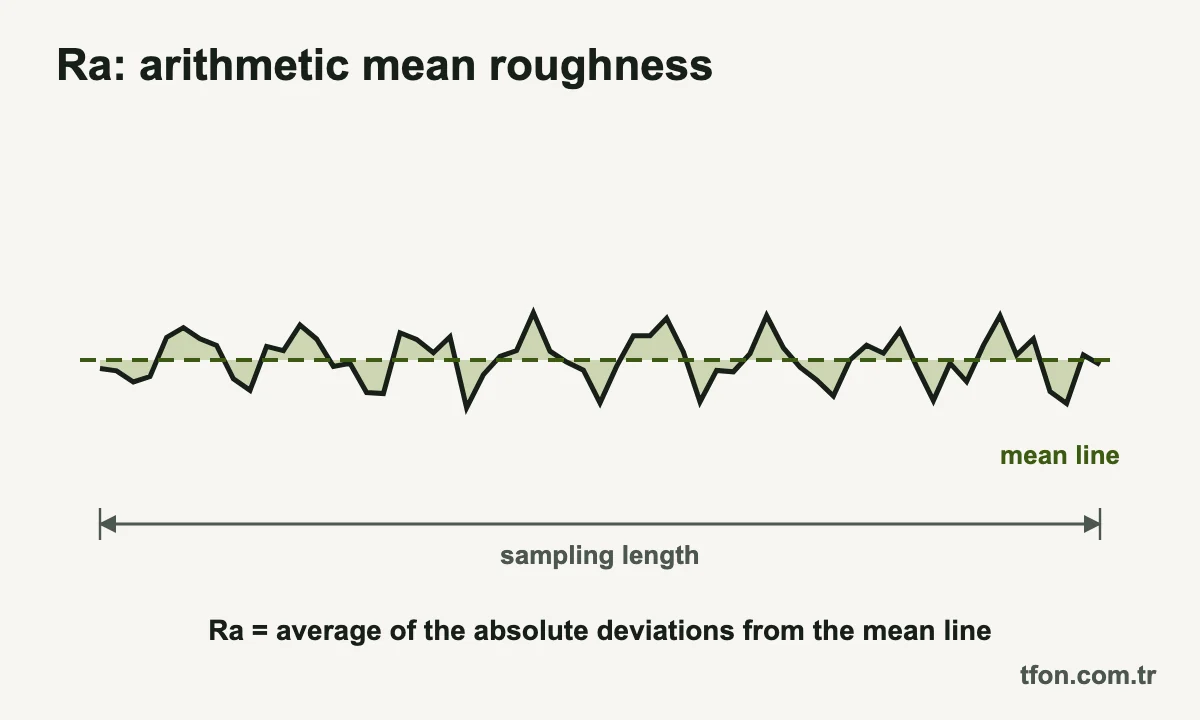
Ra and Rq are averages, so a single scratch or burr-like peak barely changes them. Rz reacts to those extremes, which is why it appears on sealing faces, under thin coatings and on many German drawings. For definitions, formulas and the older meanings of Rz, see our guide to surface roughness Ra and Rz.
Converting Ra to RMS
Rq is always at least as large as Ra on the same profile. On a sine-shaped profile Rq is 1.11 × Ra, which is where the familiar 1.1 factor comes from; it fits regular turned and milled textures. Ground, blasted and other random textures run closer to 1.25 × Ra. In US shops RMS is still often used loosely to mean Ra, so confirm which parameter the customer actually measures.
Ra to Rz Conversion: Why There Is No Exact Factor
There is no exact conversion from Ra to Rz, because the ratio depends on the shape of the profile, not on its size. Two surfaces with the same Ra can have very different Rz values if one has isolated sharp peaks and the other an even texture.
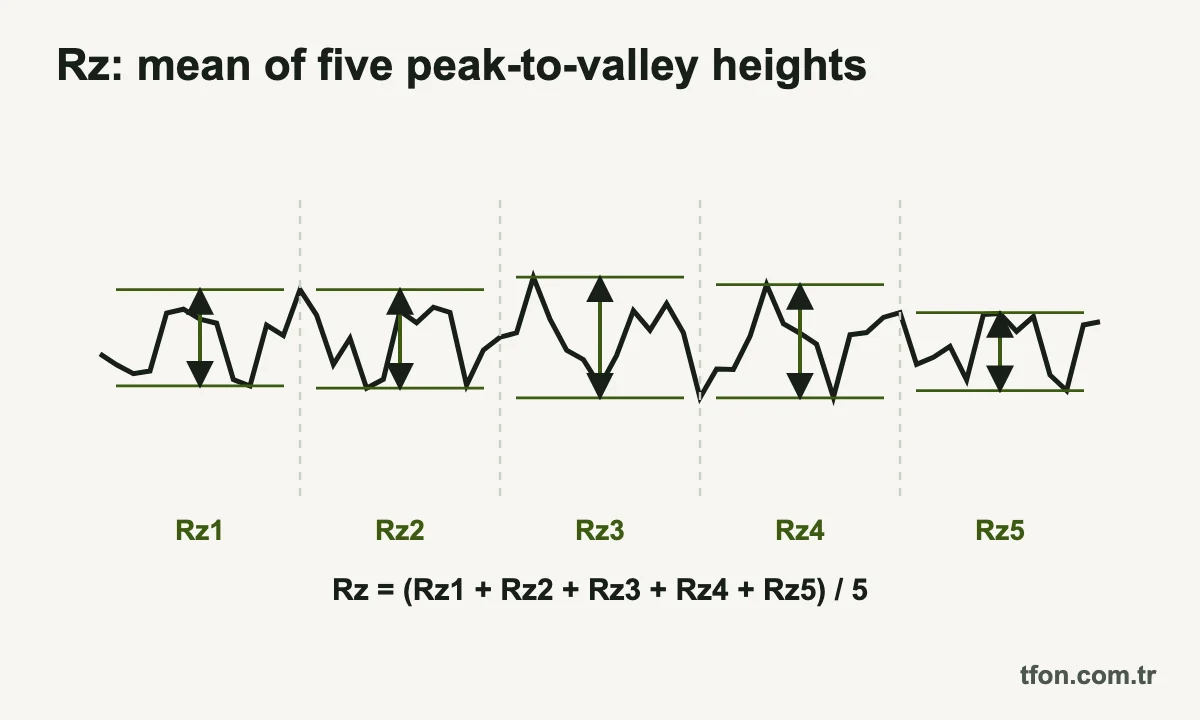
The table shows the ratios for idealized profiles. They follow from geometry and assume a profile that repeats evenly through each sampling length.
| Profile shape (idealized) | Rq / Ra | Rz / Ra | Close to |
|---|---|---|---|
| Square wave | 1.00 | 2.0 | Theoretical lower limit, not a real surface |
| Sine wave | 1.11 | 3.1 | Even, periodic textures |
| Triangle (sawtooth) wave | 1.15 | 4.0 | Feed marks of a sharp-pointed tool |
| Random (Gaussian) profile | 1.25 | No fixed value | Ground, blasted and other abraded surfaces |
The theoretical profile of turning with a round tool nose, a row of shallow arcs, gives Rz of about 3.9 × Ra. Real surfaces scatter around and beyond these cases. Comparison charts and shop rules mostly put Rz at about 4 to 7 times Ra for machined and ground surfaces. Very regular textures can fall near 3, and surfaces with isolated scratches, pits or burr-like peaks can go well above 7.
For early planning only, the next table applies the 4 to 7 rule to common Ra values. Do not use it to accept or reject parts, and do not change a drawing requirement from one parameter to the other without the customer's agreement.
| Ra (µm) | N grade | Rz planning band (µm), 4 to 7 × Ra |
|---|---|---|
| 0.4 | N5 | 1.6-2.8 |
| 0.8 | N6 | 3.2-5.6 |
| 1.6 | N7 | 6.4-11 |
| 3.2 | N8 | 13-22 |
| 6.3 | N9 | 25-44 |
| 12.5 | N10 | 50-88 |
If a drawing gives Rz, measure Rz. If supplier and customer read the same part differently, compare instrument settings first: parameter, cutoff, evaluation length and direction. Older drawings may use the former ten-point Rz definition, so confirm which Rz is meant.
ISO N Grades N1 to N12
N grades are roughness grade numbers from the older ISO 1302 practice. Each grade stands for one Ra value in micrometers from a doubling series, so N7 means Ra 1.6 µm and N8 means Ra 3.2 µm. The 1992 edition of ISO 1302 still listed them. The 2002 edition dropped them, and ISO 21920-1 does not use them.
The grades remain common on older drawings and shop charts. When you meet one, convert it with the chart and write the Ra value on any new revision. Two points matter for quoting:
- An N grade is a single Ra value. N7 does not mean anywhere between N6 and N8. Under the legacy rules it was an upper limit of Ra 1.6 µm.
- The acceptance rule follows the drawing's standard. Legacy ISO 1302 drawings used the 16 percent rule, which accepted a small share of readings above the limit. ISO 21920-1 drawings default to the max rule, where no reading may exceed it.
Machining Surface Finish Chart: Typical Ra by Process
Each manufacturing process produces roughness within a typical band. The values below are the average application ranges given in general engineering references such as Machinery's Handbook. They are typical ranges, not guarantees: tooling, feeds, material and machine condition move results in both directions, and the drawing governs. The table gives each range in micrometers and microinches with the matching N grades.
| Process | Typical Ra (µm) | Typical Ra (µin) | N grades |
|---|---|---|---|
| Sand casting, hot rolling | 12.5-25 | 500-1,000 | N10-N11 |
| Sawing | 1.6-25 | 63-1,000 | N7-N11 |
| Forging | 3.2-12.5 | 125-500 | N8-N10 |
| Drilling | 1.6-6.3 | 63-250 | N7-N9 |
| Milling | 0.8-6.3 | 32-250 | N6-N9 |
| Turning, boring | 0.4-6.3 | 16-250 | N5-N9 |
| Reaming, broaching | 0.8-3.2 | 32-125 | N6-N8 |
| Cold rolling, drawing | 0.8-3.2 | 32-125 | N6-N8 |
| Die casting | 0.8-1.6 | 32-63 | N6-N7 |
| Grinding | 0.1-1.6 | 4-63 | N3-N7 |
| Barrel finishing | 0.2-0.8 | 8-32 | N4-N6 |
| Honing, electropolishing | 0.1-0.8 | 4-32 | N3-N6 |
| Polishing | 0.1-0.4 | 4-16 | N3-N5 |
| Lapping | 0.05-0.4 | 2-16 | N2-N5 |
| Superfinishing | 0.025-0.2 | 1-8 | N1-N4 |
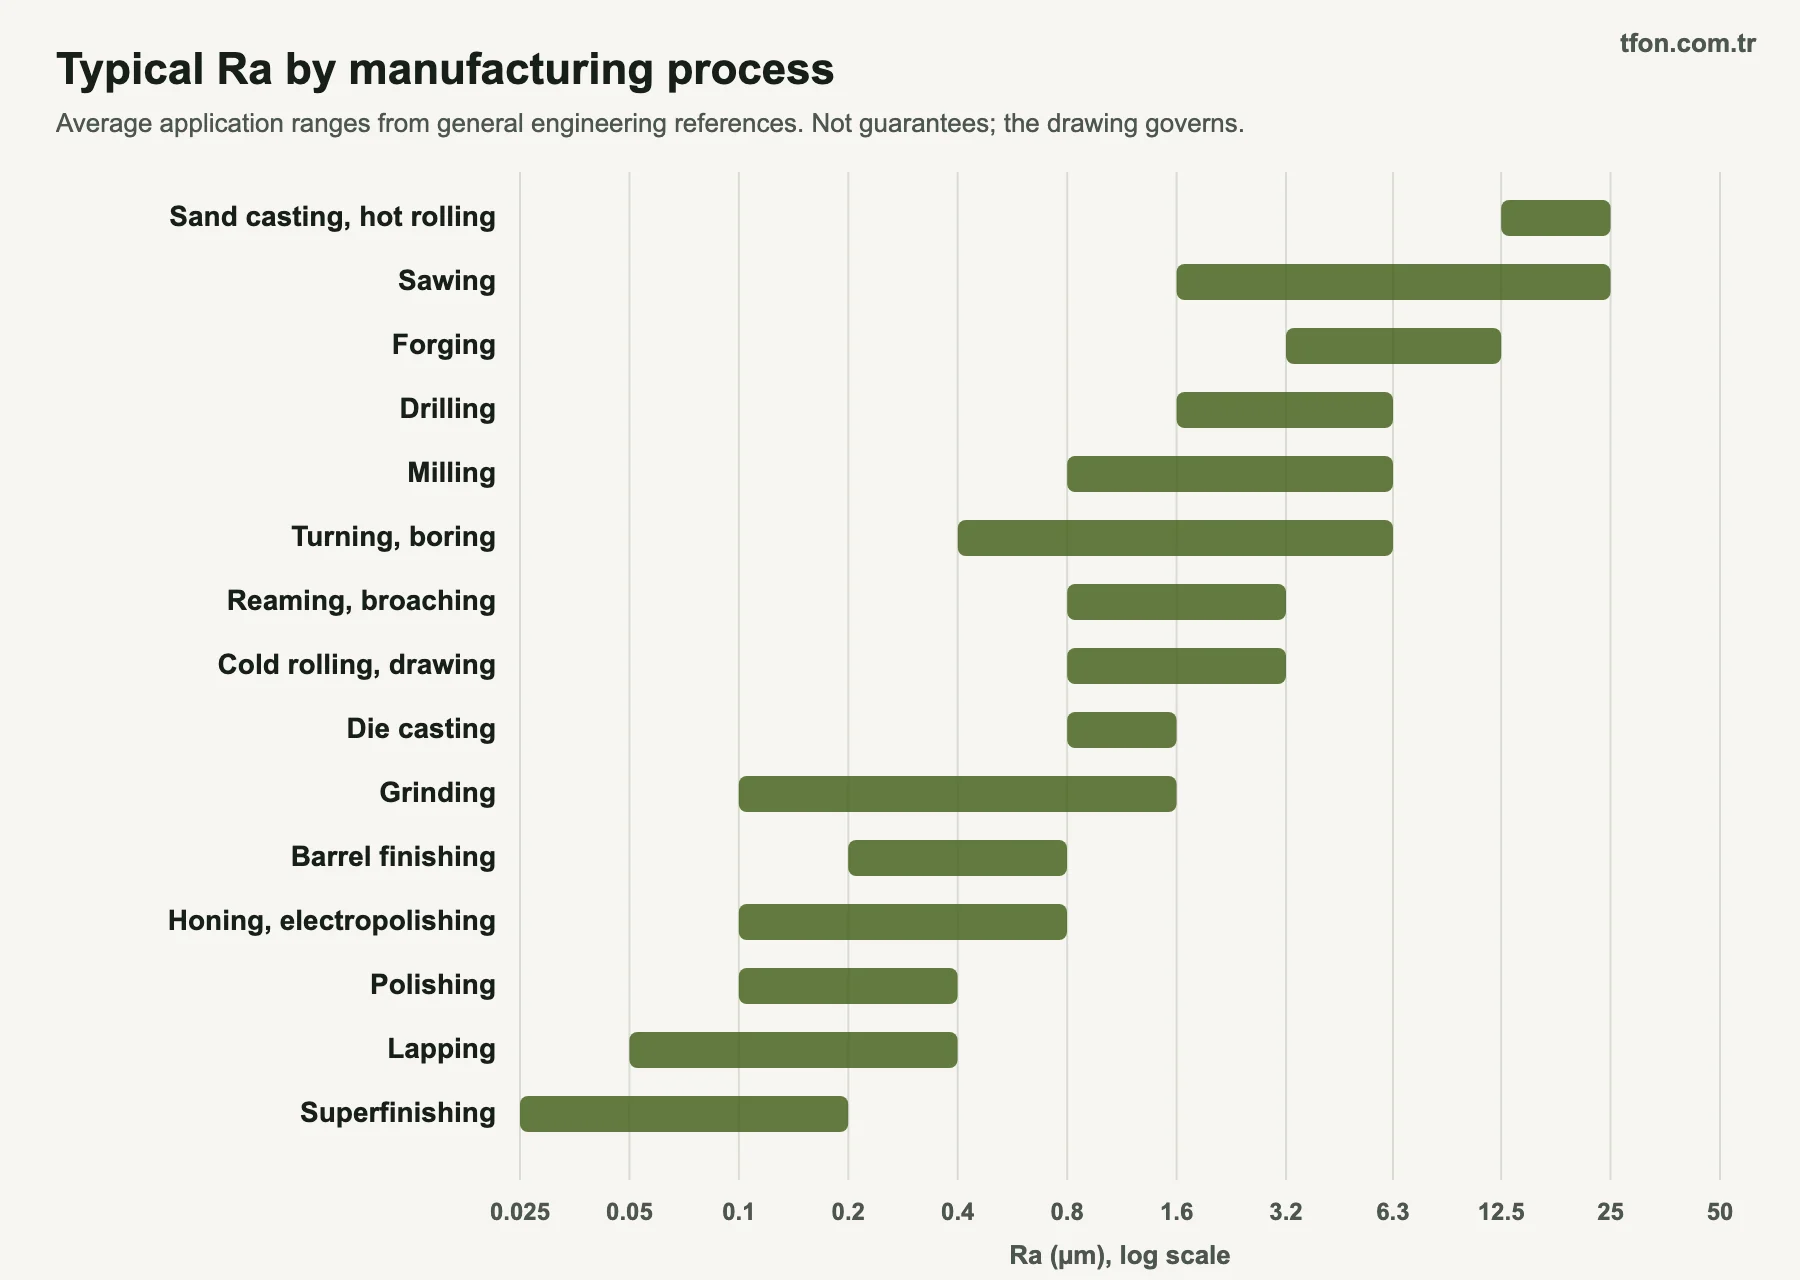
Use the table to see which processes can reach a requirement without a second operation. An Ra 3.2 µm (125 µin) face is inside the normal band of turning and milling. An Ra 0.4 µm face usually needs grinding, honing or polishing. A requirement tighter than the function needs adds cost, so check it before quoting.
Surface Finish of Cut, Ground and Satin Sheet Metal
The classic process chart covers sheet metal surfaces only in part. Thermal cut faces have their own standard, and stainless finishes are defined by mill standards rather than by process.
Laser, plasma and oxy-fuel cut faces
ISO 9013 classifies thermal cuts made by oxy-fuel, plasma and laser cutting. It does not grade the cut face by Ra. It uses the perpendicularity or angularity tolerance and the mean height of the profile, Rz5, each sorted into quality ranges whose limits grow with material thickness.
If a cut quality matters, the drawing should name the ISO 9013 range. Dross and slag on the bottom edge are a separate issue from face roughness; see slag removal and finishing plasma and oxy-fuel cut parts.
Belt-ground, brushed and satin surfaces
Belt grinding has no standard Ra range, because the result depends on grit, belt condition, pressure and the marks left by earlier steps. Stainless finish standards give the most useful reference points. The table places them, and the cut faces, on the chart.
| Surface | Reference value | Basis | Position on the chart |
|---|---|---|---|
| Oxy-fuel cut face | Ra 12.5-25 µm (500-1,000 µin), typical | General engineering references; cut quality graded under ISO 9013 | N10-N11 |
| Laser cut face | Ra 0.8-6.3 µm (32-250 µin), typical | General engineering references; cut quality graded under ISO 9013 | N6-N9 |
| Plasma cut face | No general Ra range | Graded by Rz5 and perpendicularity under ISO 9013 | - |
| Ground finish (1G, 2G) | Grit or roughness agreed between buyer and supplier | EN 10088-2 | - |
| Stainless No. 3 | Ra generally up to 40 µin (about 1.0 µm) | ASTM A480 | Between N6 and N7 |
| Stainless No. 4 | Ra generally up to 25 µin (about 0.64 µm) | ASTM A480 | Between N5 and N6 |
| Stainless 2K satin polish | Ra below 0.5 µm, measured across the grain | EN 10088-2 | Between N5 and N6 |
ASTM A480 notes that readings vary between instruments, laboratories and operators, and that No. 3 and No. 4 can overlap. A brushed or satin sheet also measures higher across the grain than along it, so a value without a direction is incomplete. For how these finishes are made and named, see the guide to types of metal finishes.
Surface Finish Symbols on Drawings
Surface finish is called out with a check-mark symbol that carries the parameter and its value. ISO 21920-1, published in 2021, replaced ISO 1302 as the ISO standard for indicating surface texture on drawings. Drawings made to ISO 1302, including older ones with N grades, remain in circulation and are read under their original rules.
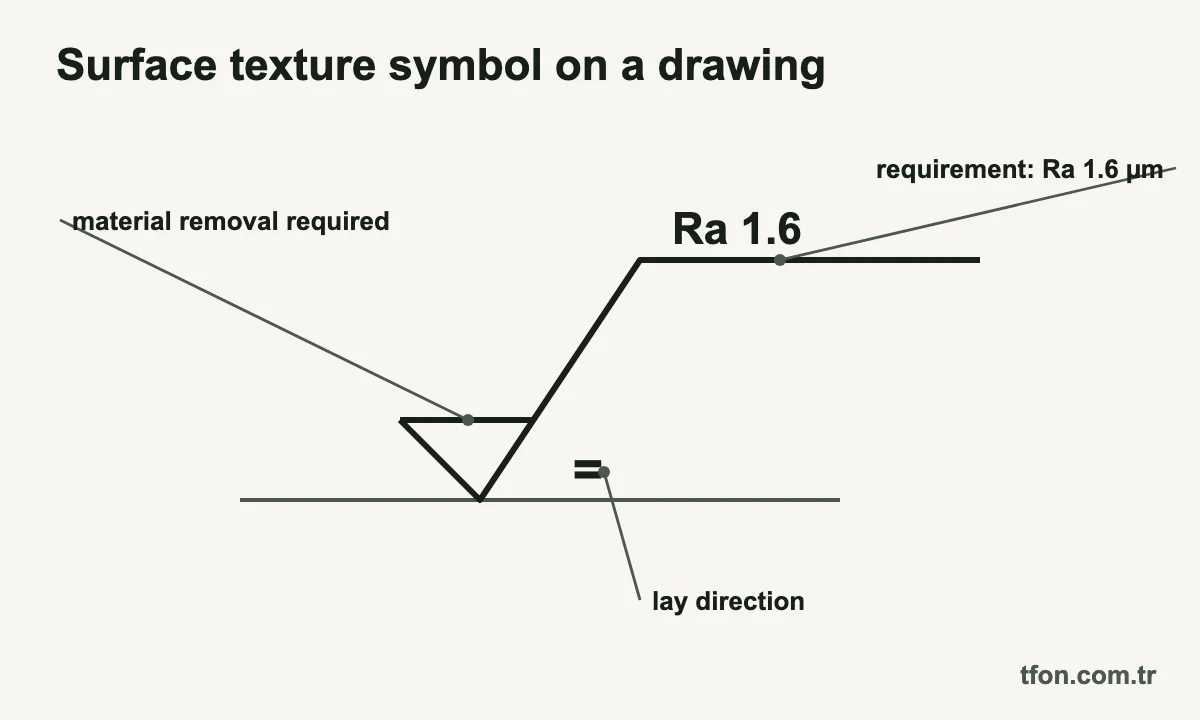
The basic symbol has three forms. The open check mark allows any process, a bar closing the V requires material removal, and a circle in the V forbids it. The requirement is written as parameter plus value, such as Ra 1.6 or Rz 6.3, with optional entries for production method, lay direction and measurement settings.
Legacy and US callouts
- N grade at the symbol: old ISO 1302 practice allowed an N number in place of the Ra value.
- Bare number on an older metric drawing: read as Ra in µm.
- Bare number on a US drawing: under ASME Y14.36 practice, a number such as 63 or 125 without a parameter means Ra in µin.
- RMS callout: confirm whether Rq or Ra is meant before quoting.
Symbol variants, lay symbols and the measurement settings that can sit on the symbol are covered in the Ra and Rz roughness guide. The lay symbol matters on brushed and satin sheet, where roughness changes with direction.
Specifying a Surface Finish for Sheet Metal Parts
A sheet metal finish callout should state the parameter, the value, the measuring direction and the faces it applies to. A grit number or a finish name alone does not define the result, because the same name means different surfaces at different suppliers.
- Parameter and value: for example Ra 0.8 µm max, or Ra 32 µin.
- Direction: across or along the grain, with the grain tied to a named edge.
- Faces: usually the visible face only.
- Edges: a burr limit or edge radius, stated separately. Ra on a flat face says nothing about the edge; edges are handled by sheet metal deburring and edge rounding.
- Reference sample: a signed sample held by both sides.
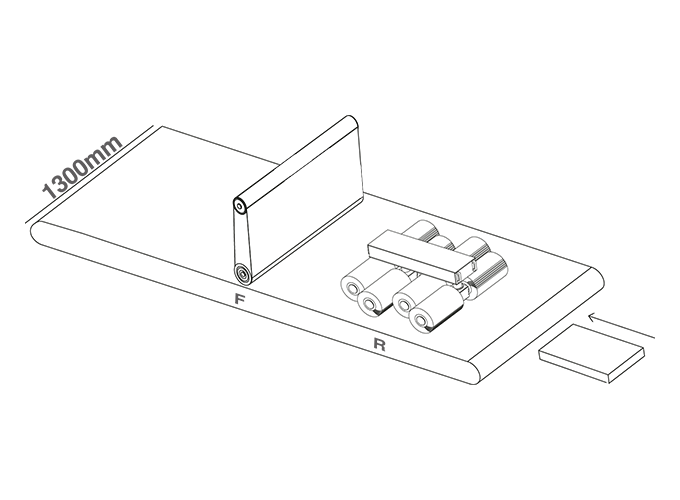
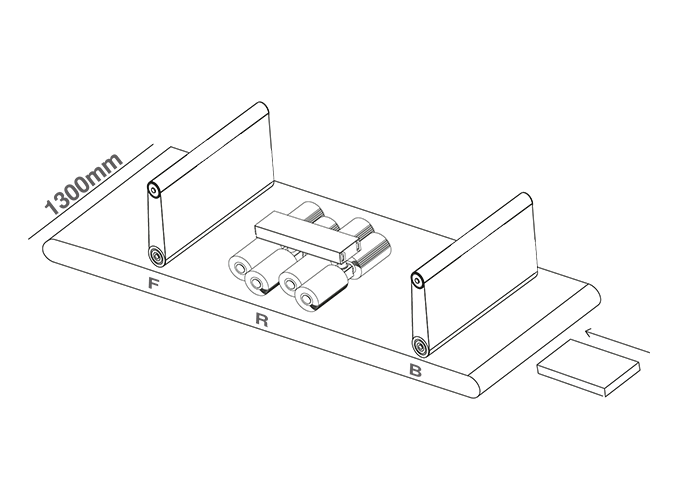
On flat laser, plasma, oxy-fuel and punched parts, these requirements are usually met on a through-feed machine. TFON Surfacer machines deburr, round edges, remove oxide and slag and apply a satin finish. The TF-RF-3013 surface finishing machine has a 1,300 mm working width, an abrasive belt plus 8 flap wheels (Ø350 mm) and a conveyor speed of 0.6-4.0 m/min. The TF-RBF-3013 deburring and finishing machine deburrs, rounds edges and applies a satin finish in one pass on the same width.
This chart contains no TFON-measured roughness values. The finish a machine reaches depends on material, incoming surface and abrasive sequence, so qualify it with a trial on your own parts and measure before and after. The sheet metal surface finishing page explains the stations, and the deburring and edge rounding machines page lists every model.
How to Measure Surface Finish
Surface finish is measured with a stylus profilometer that traces the surface and calculates Ra, Rz and other parameters from the profile. The result depends on the settings, so the settings belong on the report next to the value.
- Cutoff (λc): the filter that separates roughness from waviness. Under ISO 4288, now replaced by ISO 21920-3, non-periodic profiles with Ra over 0.1 up to 2 µm used a 0.8 mm cutoff. The other defaults were 0.25 mm up to Ra 0.1 µm, 2.5 mm up to 10 µm and 8 mm up to 80 µm.
- Evaluation length: normally five sampling lengths, so 4 mm with a 0.8 mm cutoff.
- Direction: across the lay unless the drawing says otherwise. On brushed sheet, a trace along the grain reads lower.
- Location: a clean, flat area away from edges, holes and handling marks.
Roughness comparison specimens let an inspector judge a surface by sight and touch against samples of known Ra. They suit quick screening, not acceptance, and only work when the specimen was made by the same process as the part.
TFON Machines for This Job
-
TFON Surfacer® TF-RF-3013
Surface finishing machine; 1,300 mm working width; abrasive belt plus 8 flap wheels (Ø350 mm); conveyor 0.6-4.0 m/min
Specifications Request a Quote -
TFON Surfacer® TF-RBF-3013
Deburring and finishing machine; 1,300 mm working width; deburring and satin finish in one pass
Specifications Request a Quote
Frequently Asked Questions
What is a surface finish chart?
A surface finish chart, also called a surface roughness chart, is a conversion table for roughness values. It lines up ISO N grades, Ra in µm, Ra in µin and often RMS, so a value from one system can be read in another. The chart on this page covers N1 to N12, Ra 0.025 to 50 µm.
What is a 125 surface finish?
A 125 surface finish is Ra 125 µin, which is Ra 3.2 µm and grade N8. It sits in the normal band of turned and milled surfaces and is often used for general machined faces on US drawings. The exact conversion of 3.2 µm is 126 µin; 125 is the rounded chart value.
How do you convert Ra to Rz?
You cannot convert Ra to Rz exactly, because the ratio depends on the profile shape. For planning, Rz is often estimated at 4 to 7 times Ra, so Ra 1.6 µm suggests Rz of roughly 6 to 11 µm. Measure Rz directly whenever the drawing calls for it.
Is RMS the same as Ra?
No. RMS, now called Rq, is the root mean square of the profile deviations, while Ra is their arithmetic average. Rq is about 1.1 times Ra on regular, periodic profiles and about 1.25 times Ra on random ones. Treat any conversion between them as an estimate.
What does N8 mean in surface finish?
N8 is an ISO roughness grade meaning Ra 3.2 µm, about 125 µin. N grades come from older editions of ISO 1302 and were dropped from the 2002 edition. On new drawings, write Ra 3.2 instead.
What surface finish does laser cutting give?
General engineering references list laser cutting at typically Ra 0.8 to 6.3 µm (32 to 250 µin). The real value depends on material, thickness, assist gas and machine condition. ISO 9013 grades cut quality by perpendicularity and Rz5, not by Ra, so measure your own parts if the value matters.
Is ISO 1302 still valid?
No. ISO 1302 was withdrawn and replaced by ISO 21920-1 in 2021. Existing drawings made to ISO 1302 are still read under the rules they were made with. New drawings should follow ISO 21920-1 and state the parameter and value.
What Ra is a No. 4 or satin finish?
ASTM A480 gives a No. 4 stainless finish an Ra of generally up to 25 µin, about 0.64 µm, which falls between N5 and N6. EN 10088-2 limits a 2K satin polish to below Ra 0.5 µm across the grain. Other satin finishes have no standard value, so agree a limit, a direction and a reference sample.
Let Us Review Your Part
Share the material, cutting method, part dimensions and the next operation, with photos of both faces. We will recommend the machine and station sequence that fits the part.